The Shamrock diagram was developed during the European MACRO Project to explain and demonstrate how conflicting business drivers can be crystallized into quantifiable scales of significance.
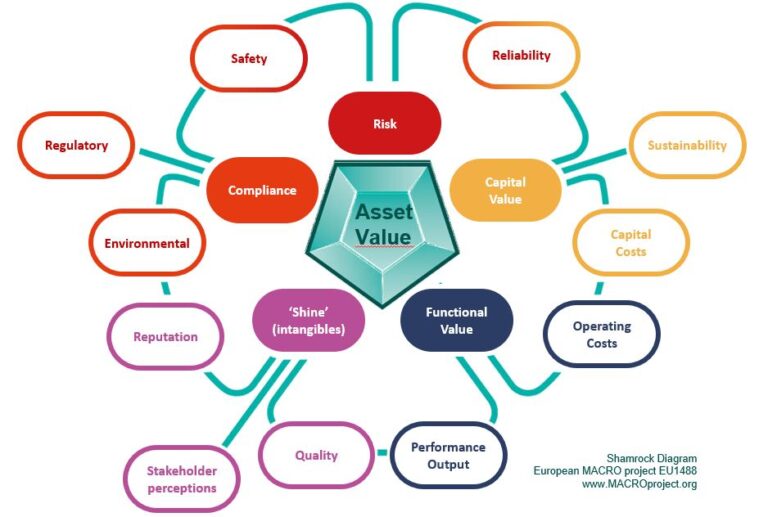
The outer ring represents typical words and aspirations in corporate goals. These attributes commonly appear in ‘mission statements’, values and other expectations placed upon the organization by various stakeholders.
For example….
NewCO Mission Statement
” We wish to be a safe, reliable operator, over the long term, while controlling capital and operating costs, delivering high performance and quality services, satisfying our customers, being a responsible contributor to society, taking care of the environment and, complying with all regulatory requirements.”
A nice sounding statement but not a very useful listing of mutually incompatible goals!
The Macro Project, over 4 years of research in multiple industries and regulatory environments, identified 5 mechanisms for putting a quantitative scale on any mixture of these goals, they form the inner ring of the Shamrock diagram.
…the spectrum of discrete events that have probabilities and consequences, ranging from the small and many to the rare but serious.
…the ratio of what is going into the system (e.g. resources, expenditure) to what is coming out (performance, service, quality outputs). The unit cost of production are typical indicators of this.
…describes the sustainability motives, quantified by the present-day economic advantage of deferring future expenditures, taking account of the time value of money etc.
Note, if the organization was totally self-sufficient and introspective, these three would be enough – and zero risk, infinite sustainability and, 100% efficiency would represent ‘perfection’. However, there are 2 forms of external ‘modifiers’ that need to be considered. These are…
…the black & white obligations, for which an organization pays a premium, over and above the genuine risk, sustainability or efficiency reasons for doing things. The quantification of this ‘premium paid’ has to be indirect – calculated as the difference between what would be done compared to what the compliance obligations require.
…these cover the ‘perception’ measures such as customer satisfaction, reputation, company morale etc., whose common feature is their intangible difficult-to-quantify nature. These are ‘shades of grey’, in contrast to the black & white, and the scaling of their significance is also indirect.
The green lines of the Shamrock Diagram are just examples of connectivity.
There are more connections possible (but that would draw a spider web!). For example, ‘safety’ covers 3 of the RELiCS – there is a Risk benefit, that can be quantified in terms of incident frequencies and seriousness; an organization has a motivation to be Compliant with safety legislation, and Reputation for safety is valuable and can justify more action than just the legal minimum.